What Is Grafana?
Grafana is a leading open-source platform designed for data visualization, monitoring, and analytics. It allows users to combine and show data from multiple sources. Whether you’re analyzing performance metrics, monitoring infrastructure, or visualizing key metrics, Grafana transforms big data into easily accessible and intuitive dashboards.
With over 150 plugins, such as Jira and Google Sheets, Grafana supports seamless integration, making it an excellent choice for monitoring data analytics. Its ability to unify vast amounts of information into a single, user-friendly web page ensures that you can effectively harness your data for better decision-making and understanding.
Why Use Grafana Dashboards?
Grafana dashboards are a powerful tool for visualizing data from various data sources in one centralized location. They streamline the process of sharing critical insights with stakeholders, teams, and customers, ensuring everyone stays informed.
Grafana simplifies complex data by converting it into visually engaging and fully customizable panels. The flexibility of Grafana's dashboard design lets users create a clear and concise view of important metrics. This adaptability ensures that key insights are easy to focus on and presented in a way that's both intuitive and impactful.
To maximize the value of your Grafana dashboards, consider integrating them with digital signage. Displaying crucial information, such as energy infrastructure monitoring, live data during important testing, or system performance analytics, promotes better visibility and awareness in critical systems or environments. This visibility can prompt quicker issue identification, foster deeper insights and decision-making, and simplify troubleshooting processes.
With OptiSigns you can seamlessly showcase your Grafana dashboards anywhere you need it to be, ensuring key metrics are always visible.
How To Display Your Grafana Dashboard Using The Web Scripting App
To display Grafana dashboards on your screens, you’ll need to set it up using the OptiSigns web scripting app. This lets you automate navigation and form entries without the need for coding. Forget having to log in every single time!
Three steps exist to start displaying your dashboard on digital signage displays with OptiSigns:
- Install Burp Suite Navigation Recorder
- Record Your Script
- Create and Push Your Web Scripting App
Once finished, OptiSigns will display your dashboard for everyone to see! Below, we’ll walk you through each step in more detail.
NOTE: To display your Grafana dashboards through OptiSigns, you’ll need to have an email address and password login.
Install Burp Suite Navigation Recorder
Open Chrome, then go to the Chrome Web Store and search for “Burp Suite Navigation Recorder”. Click “Add to Chrome" to gain access to the extension.

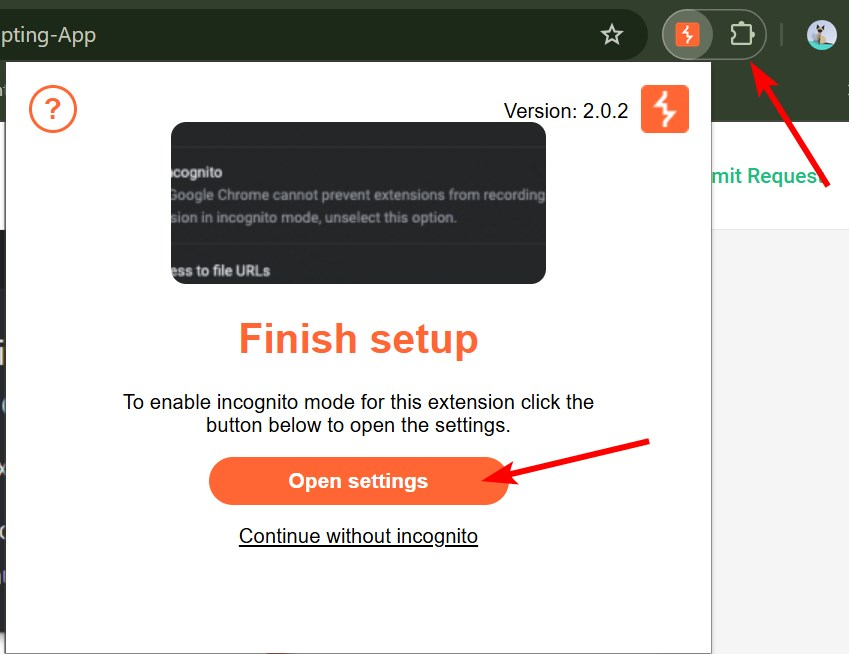
Once added, open the extension’s settings, enable “Allow in Incognito,” and close the tab.

Record The Web Script
Recording the web script for your dashboard involves inputting three essential pieces of information:
- A direct URL to the Grafana dashboard you would like to display
- Your login email address
- Your login password
NOTE: Your password will not be displayed on screen as you type it out.
First, copy the URL of your Grafana dashboard you’d like to display and have it waiting in your clipboard.

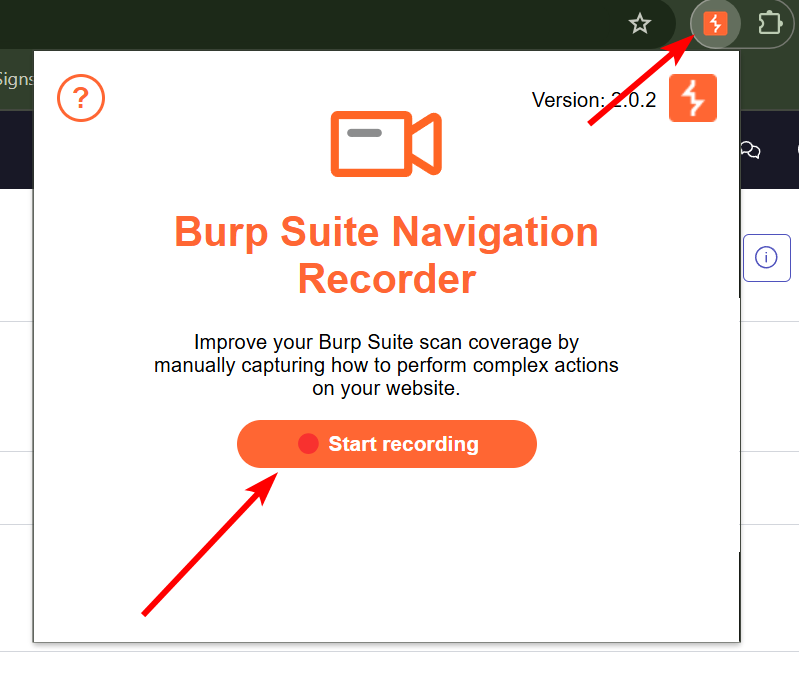
Next, open the Burp Suite Navigation Recorder extension from your extension manager, and click “Start Recording”. This will open an incognito window.

When the window opens, paste the URL to your Grafana dashboard in the address bar at the top. Fill out your login information, making sure you enter it carefully and correctly. If you mess up, you will need to restart the recording process.
Tip: Always use the mouse for clicks and avoid corrections during entry.
Once you log in and the dashboard displays, either close the window or open the Burp Suite extension and click “Stop Recording.”
Burp Suite will automatically copy the script to your clipboard once you close the incognito window. However, you can also open the extension and select “Copy to Clipboard” if you lose your script.
NOTE: If you create another recording or shut down your computer, your script will be overwritten or lost.
Create a Web Scripting Asset in OptiSigns
With the recording script in your clipboard, log in to your OptiSigns account and open the Files/Assets page to create your asset. Click on "Apps" and search for the “Web Scripting” app within our list of 160+ app integrations. Open this app and you will see this:

Give your asset a name within OptiSigns so that you can easily find it within your account. Then, paste the script that is waiting in your clipboard into the “Recorded Script” box.
Finally, after you click save, you can push your dashboard to the screens where you need it most!


